The Fred Adams Group of RE/MAX Integrity
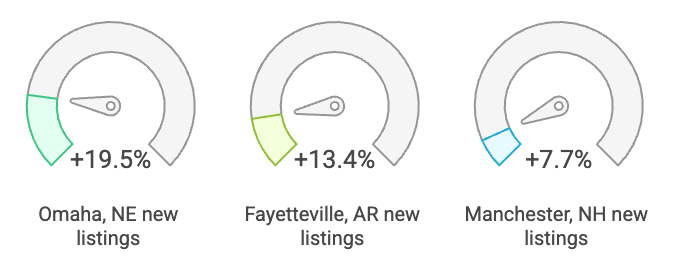
In the 51 metro areas surveyed in August 2025, the number of newly listed homes was down 5.9% compared to August 2024, and down 9.2% compared to July 2025. The markets with the biggest decrease in year-over-year new listings percentage were Trenton, NJ at -44.8%, Dover, DE at -37.9%, and Philadelphia, PA at -37.6%. The markets with the biggest year-over-year increase in new listings percentage were Omaha, NE at +19.5%, Fayetteville, AR at +13.4%, and Manchester, NH at +7.7%.
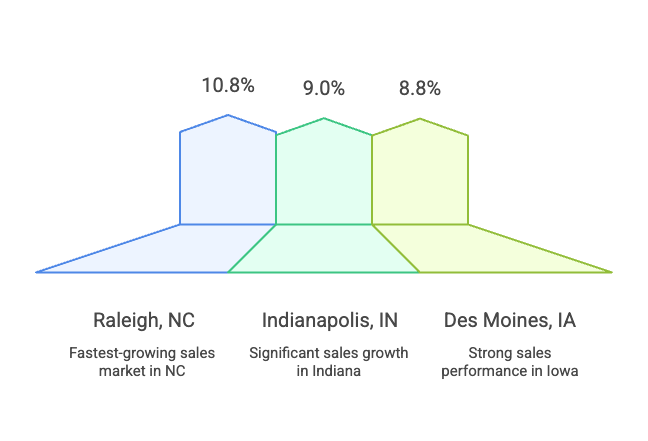
Of the 51 metro areas surveyed in August 2025, the overall number of home sales was down 1.6% compared to August 2024, and down 5.5% compared to July 2025. The markets with the biggest decrease in year-over-year sales percentages were Trenton, NJ at -11.1%, San Diego, CA at -9.4%, and San Francisco, CA at -9.2%. The markets with the biggest increase in year-over-year sales percentages were Raleigh, NC at +10.8%, Indianapolis, IN at +9.0%, and Des Moines, IA at +8.8%.
In August 2025, the median of all 51 metro area sales prices was $448,000, up 1.9% from August 2024, and down 0.6% compared to July 2025. The markets with the biggest year-over-year increase in median sales price were Manchester, NH at +9.2%, Coeur d’Alene, ID at +9.0%, and Trenton, NJ at +8.5%. The markets with the biggest year-over-year decrease in median sales price were Bozeman, MT at -4.9%, San Antonio, TX at -4.7%, and Tulsa, OK at -4.3%.

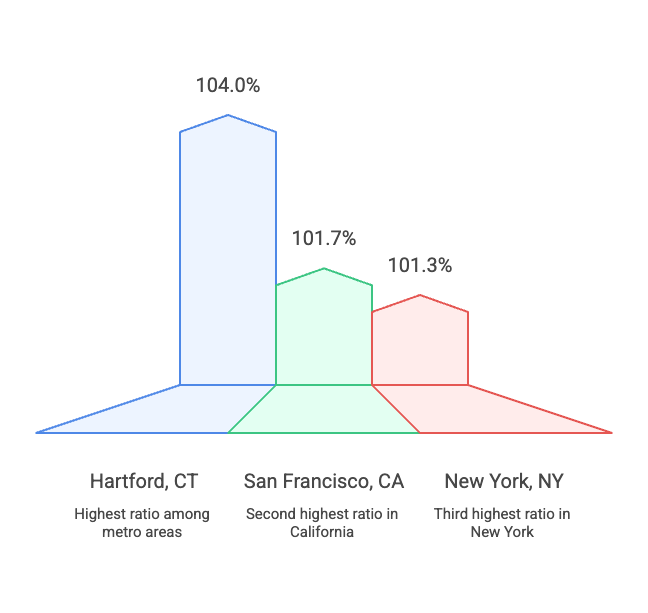
In August 2025, the average close-to-list price ratio of all 51 metro areas in the report was 99%, the same as August 2024 and July 2025. The close-to-list price ratio is calculated by the average value of the sales price divided by the list price for each transaction. When the number is above 100%, the home closed for more than the list price. If it’s less than 100%, the home sold for less than the list price. The metro areas with the highest close-to-list price ratios were Hartford, CT at 104.0%, San Francisco, CA at 101.7%, and New York, NY at 101.3%. The metro areas with the lowest close-to-list price ratio were Miami, FL at 93.7%, San Antonio, TX at 95.7%, followed by a tie between Bozeman, MT and Tampa, FL at 96.4%.
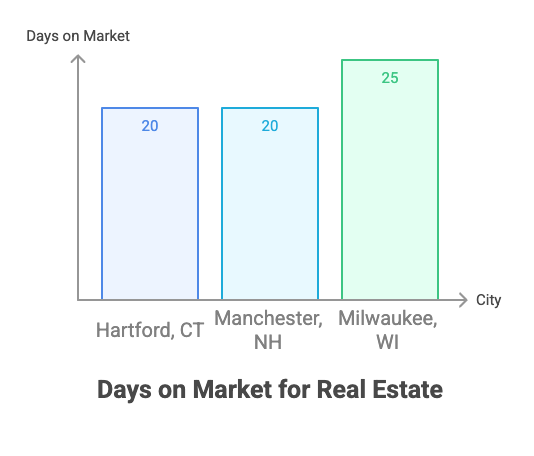
The average days on market for homes sold in August 2025 was 47, up eight days compared to the average in August 2024 and up three days compared to July 2025. The metro areas with the highest days on market averages were Miami, FL at 80, San Antonio, TX at 79, and Coeur d’Alene, ID at 75. The lowest days on market were Hartford, CT and Manchester, NH tied at 20, followed by Milwaukee, WI at 25. Days on market is the number of days between when a home is first listed in an MLS and a sales contract is signed.
U.S. home sales dipped in August, falling 1.6% from August 2024 and 5.5% from July 2025. The slowdown coincided with the end of a 17-month streak of year-over-year growth in new listings, which dropped 5.9% year over year and 9.2% month over month.
Despite the drop in sales activity, inventory remained 24.4% higher than one year ago, although it eased down 0.4% from July. At the same time, the Median Sales Price rose 1.9% year over year to $448,000, marking the 26th consecutive month of annual price gains. Home prices have not declined year over year since June 2023. Month over month, however, prices slipped 0.6%, or $2,500.
Homes lingered on the market an average of 47 days in August—up eight days from a year ago and three days longer than July—according to data from the 51 metro areas surveyed.
“Housing market activity has recently been influenced by seasonal shifts and broader economic forces,” said Erik Carlson, CEO of RE/MAX Holdings, Inc. “While affordability remains a challenge in many areas, despite some recent improvements in mortgage rates, opportunities persist—especially in markets where prices have stabilized or inventory has improved. Buyers and sellers who stay informed and work with experienced agents are best positioned to navigate today’s market.”
Other metrics of note:
The RE/MAX National Housing Report is distributed each month on or about the 15th. The first Report was distributed in August 2008. The Report is based on MLS data in approximately 53 metropolitan areas, includes all residential property types, and is not annualized. For maximum representation, many of the largest metro areas in the country are represented, and an attempt is made to include at least one metro from each state. Metro area definitions include the specific counties established by the U.S. Government’s Office of Management and Budget, with some exceptions.
Transactions are the total number of closed residential transactions during the given month. Months Supply of Inventory is the total number of residential properties listed for sale at the end of the month (current inventory) divided by the number of sales contracts signed (pended) during the month. Where “pended” data is unavailable, this calculation is made using closed transactions. Days on Market is the number of days that pass from the time a property is listed until the property goes under contract for all residential properties sold during the month. Median Sales Price is the median of the median sales prices in each of the metro areas included in the survey.
MLS data is provided by contracted data aggregators, RE/MAX brokerages and regional offices. While MLS data is believed to be accurate, it cannot be guaranteed. MLS data is constantly being updated, making any analysis a snapshot at a particular time. Every month the RE/MAX National Housing Report re-calculates the previous period’s data to ensure accuracy over time. All raw data remains the intellectual property of each local MLS organization.