The Fred Adams Group of RE/MAX Integrity
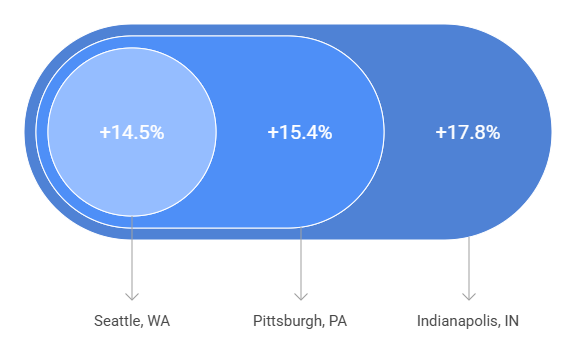
In the 51 metro areas surveyed in April 2026, the number of newly listed homes was down 1.3% compared to April 2025, and up 10.5% compared to March 2026. The markets with the biggest decrease in year-over-year new listings percentage were Dover, DE at -33.0%, Trenton, NJ at -28.3% and Baltimore, MD at -23.4%. The markets with the biggest year-over-year increase in new listings percentage were Indianapolis, IN at +17.8%, Pittsburgh, PA at +15.4% and Seattle, WA at +14.5%.
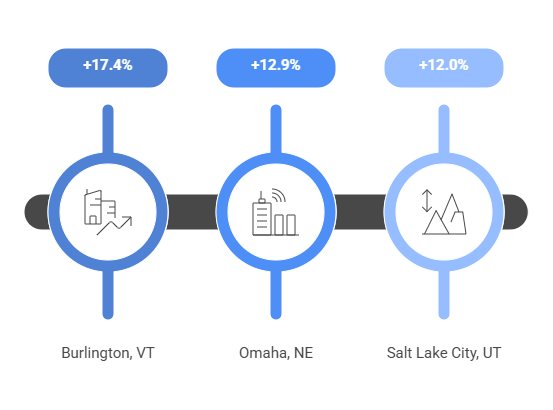
Of the 51 metro areas surveyed in April 2026, the overall number of home sales was up 0.1% compared to April 2025, and up 7.6% compared to March 2026. The markets with the biggest increase in year-over-year sales percentage were Burlington, VT at +17.4%, Omaha, NE at +12.9% and Salt Lake City, UT at +12.0%. The markets with the biggest decrease in year-over-year sales percentages were Hartford, CT at -11.8%, Honolulu, HI at -8.4% and Providence, RI at -8.2%.
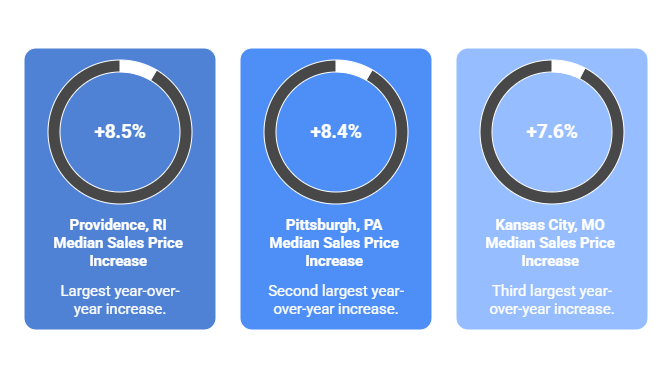
In April 2026, the median of all 51 metro area sales prices was $445,000, up 1.5% from April 2025 and up 1.4% compared to March 2026. The markets with the biggest year-over-year increase in median sales price were Providence, RI at +8.5%, Pittsburgh, PA at +8.4% and Kansas City, MO at +7.6%. The markets with the biggest year-over-year decrease in median sales price were Burlington, VT at -7.2%, Bozeman, MT at -2.3% and Houston, TX, Minneapolis, MN and Seattle, WA tied at -2.0%.
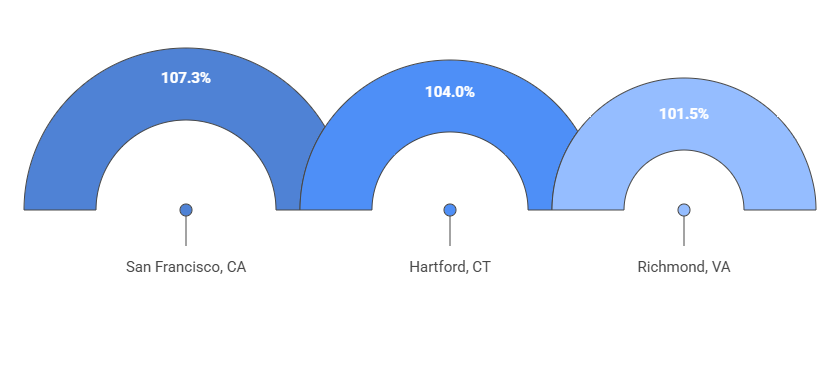
In April 2026, the average close-to-list price ratio of all 51 metro areas in the report was 99%, the same as April 2025 and March 2026. The close-to-list price ratio is calculated by the average value of the sales price divided by the list price for each transaction. When the number is above 100%, the home closed for more than the list price. If it’s less than 100%, the home sold for less than the list price. The metro areas with highest close-to-list price ratios were San Francisco, CA at 107.3%, Hartford, CT at 104.0% and Richmond, VA at 101.5%. The metro areas with the lowest close-to-list price ratio were Miami, FL at 93.9%, Tampa, FL at 96.6% and Houston, TX at 96.9%.
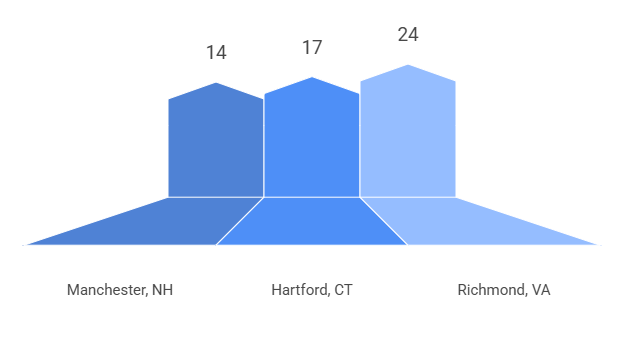
The average days on market for homes sold in April 2026 was 45, up four days compared to the average in April 2025 and down five days compared to March 2026. Days on market is the number of days between when a home is first listed in an MLS and a sales contract is signed. The metro areas with the highest days on market averages were San Antonio, TX at 84 (+7.5%), Miami, FL at 78 (+1.7%) and Phoenix, AZ at 72 (+9.7%). The markets with the lowest days on market averages were Manchester, NH at 14 (-6.6%), Hartford, CT at 17 (-8.0%) and Richmond, VA at 24 (-2.1%).
Home sales increased in April, but the number of new listings outpaced demand, creating more available inventory and continuing a shift toward a more balanced housing market.
Typical for the spring selling season, April home sales grew 7.6% over March, while new listings increased 10.5% during the month. Across the 51 metro areas surveyed, year-over-year activity was largely unchanged, with sales up just 0.1% and new listings down 1.3%.
The number of homes for sale grew 4.5% over March 2026 and 2.0% year over year. The median sales price increased 1.5% to $445,000 – the 34th consecutive month of year-over-year price appreciation.
“April’s housing data shows a market that’s continuing to find its balance,” said REMAX® President and Chief Growth Officer Chris Lim. “More homes came onto the market faster than buyers were purchasing, which means buyers had more choices than they’ve had in a while. At the same time, prices were stable. Overall, it’s a steadier, less competitive environment than we’ve seen recently, and that’s giving both buyers and sellers a better chance to make confident decisions.”
Baltimore, Maryland, ranked among the top five metro areas for the largest year-over-year decline in new listings, down 23.4%. Month over month, however, the market landed closer to the national average, with listings rising 12.5%.
Ricky Cantore, a sales associate with REMAX Advantage Realty in Columbia, Maryland, said that while rising inventory is beginning to create more opportunities for buyers, conditions remain uneven across neighborhoods and still favors sellers in certain areas.
“We’re seeing more homes come onto the market in certain areas, but overall inventory is still relatively tight, and conditions can vary dramatically from one neighborhood to the next,” said Cantore. “In some cases, well-prepared homes are still getting 20 or more offers and selling well above asking, while others are sitting longer if they’re not priced right. It’s more balanced than it’s been in recent years, but buyers still need to be well-prepared and ready to act quickly — and sellers who adjust their pricing early are ultimately positioning themselves for the strongest results.”
Other metrics of note include:
The RE/MAX National Housing Report is distributed each month on or about the 15th. The first Report was distributed in August 2008. The Report is based on MLS data in approximately 53 metropolitan areas, includes all residential property types, and is not annualized. For maximum representation, many of the largest metro areas in the country are represented, and an attempt is made to include at least one metro from each state. Metro area definitions include the specific counties established by the U.S. Government’s Office of Management and Budget, with some exceptions.
Transactions are the total number of closed residential transactions during the given month. Months Supply of Inventory is the total number of residential properties listed for sale at the end of the month (current inventory) divided by the number of sales contracts signed (pended) during the month. Where “pended” data is unavailable, this calculation is made using closed transactions. Days on Market is the number of days that pass from the time a property is listed until the property goes under contract for all residential properties sold during the month. Median Sales Price is the median of the median sales prices in each of the metro areas included in the survey.
MLS data is provided by contracted data aggregators, RE/MAX brokerages and regional offices. While MLS data is believed to be accurate, it cannot be guaranteed. MLS data is constantly being updated, making any analysis a snapshot at a particular time. Every month the RE/MAX National Housing Report re-calculates the previous period’s data to ensure accuracy over time. All raw data remains the intellectual property of each local MLS organization.